tanzhijian.org
that-game 的可视化功能探讨
我发现 that-game 通过设计好的数据格式,或许可以很方便的完成各个级别的可视化
文章只为探讨,所有的示例图都为引用的效果图,其具体功能还未实现
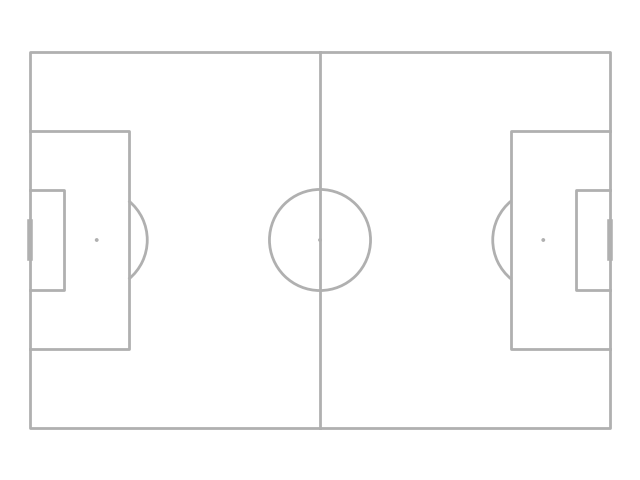
Pitch
pitch = Pitch(length=105, width=68)
pitch.show()
pitch = Pitch(length=105, width=68, vertical=True)
pitch.show()
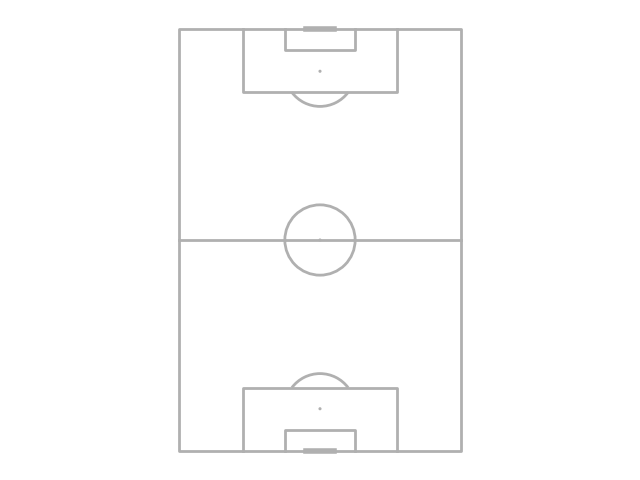
这样可以很方便的预览设置的 pitch 是否与自己心目中的一样
Location
每一个单独的 Location 都可以单独的查看在 pitch 中的位置
location = Location(x=60, y=40, pitch=pitch)
location.show()
Event
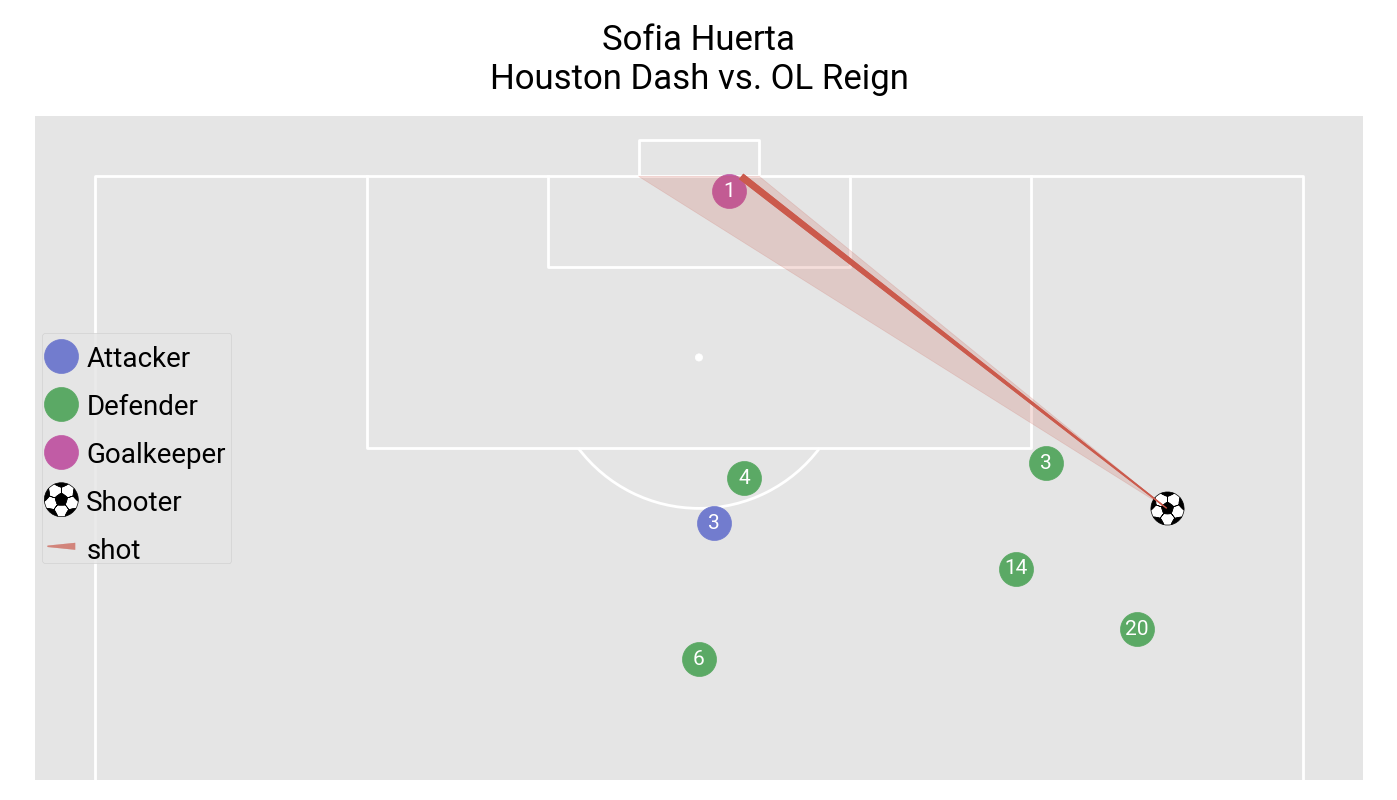
Shot
可以预览单次射门的状况
shot = Shot(...)
shot.show()
Pass
可以预览单次 pass 的传球图,传球方,接球方,球的轨迹,穿过的球员(如果有)
其他
其他的一些 type 类我还没有写完,比如 duel, block, dribble, 都会以单点的形式在 pitch 上描绘
Game
可以从 game 的角度查看更多
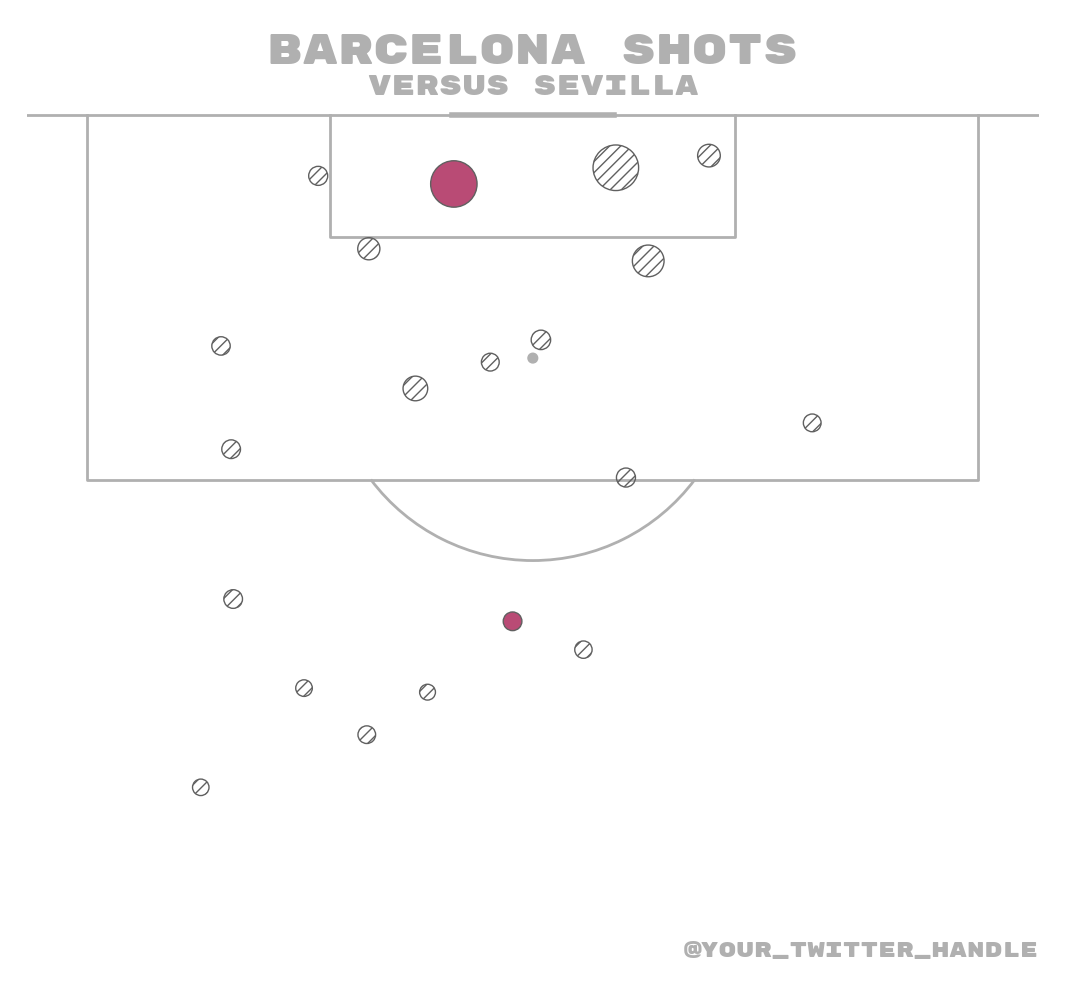
shots
game = Game(...)
shots = game.shots()
shots.shotmap(selected='home')
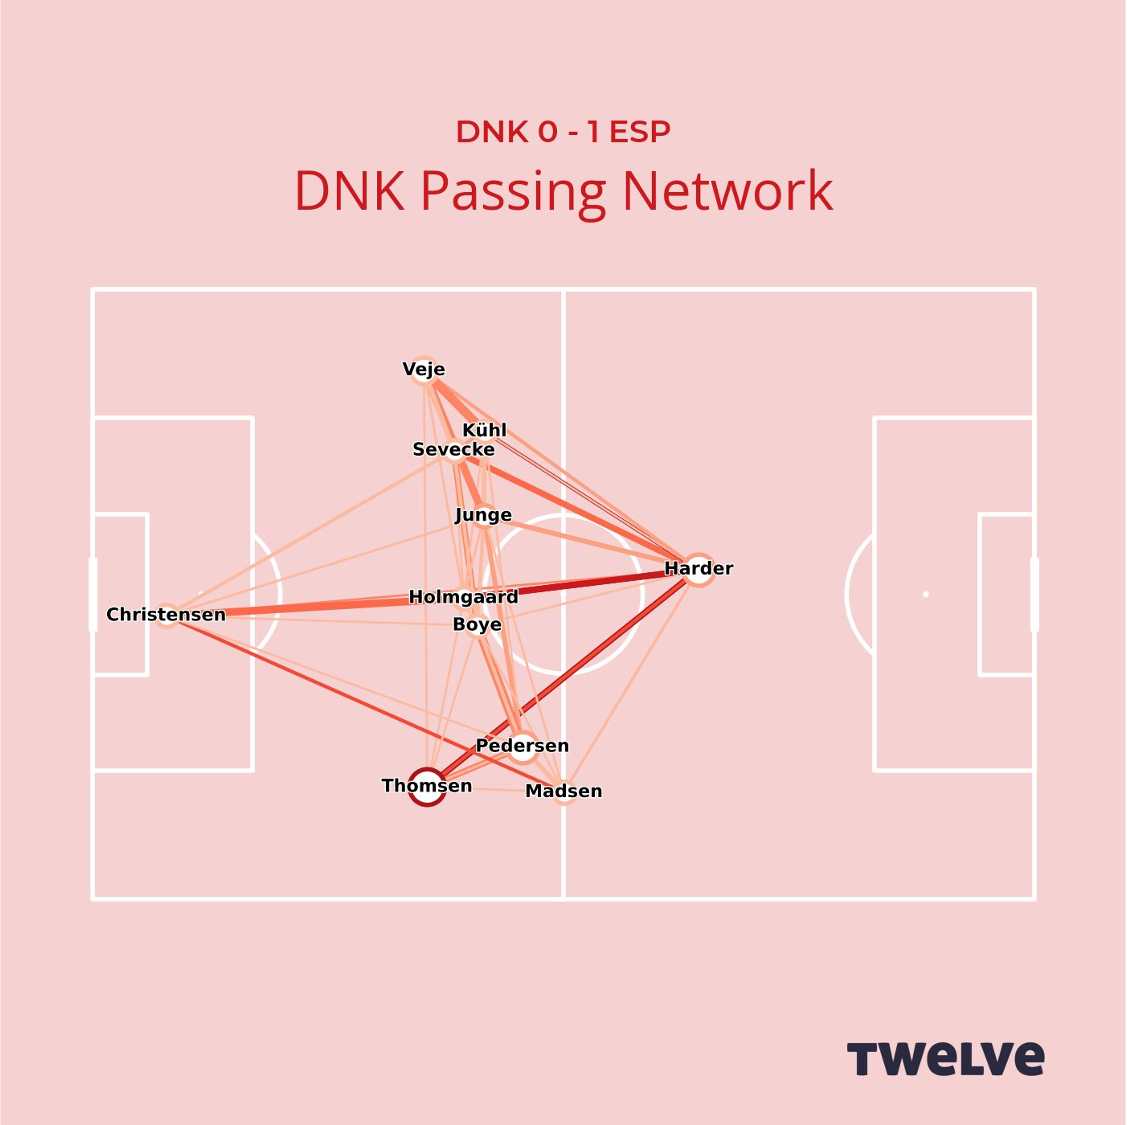
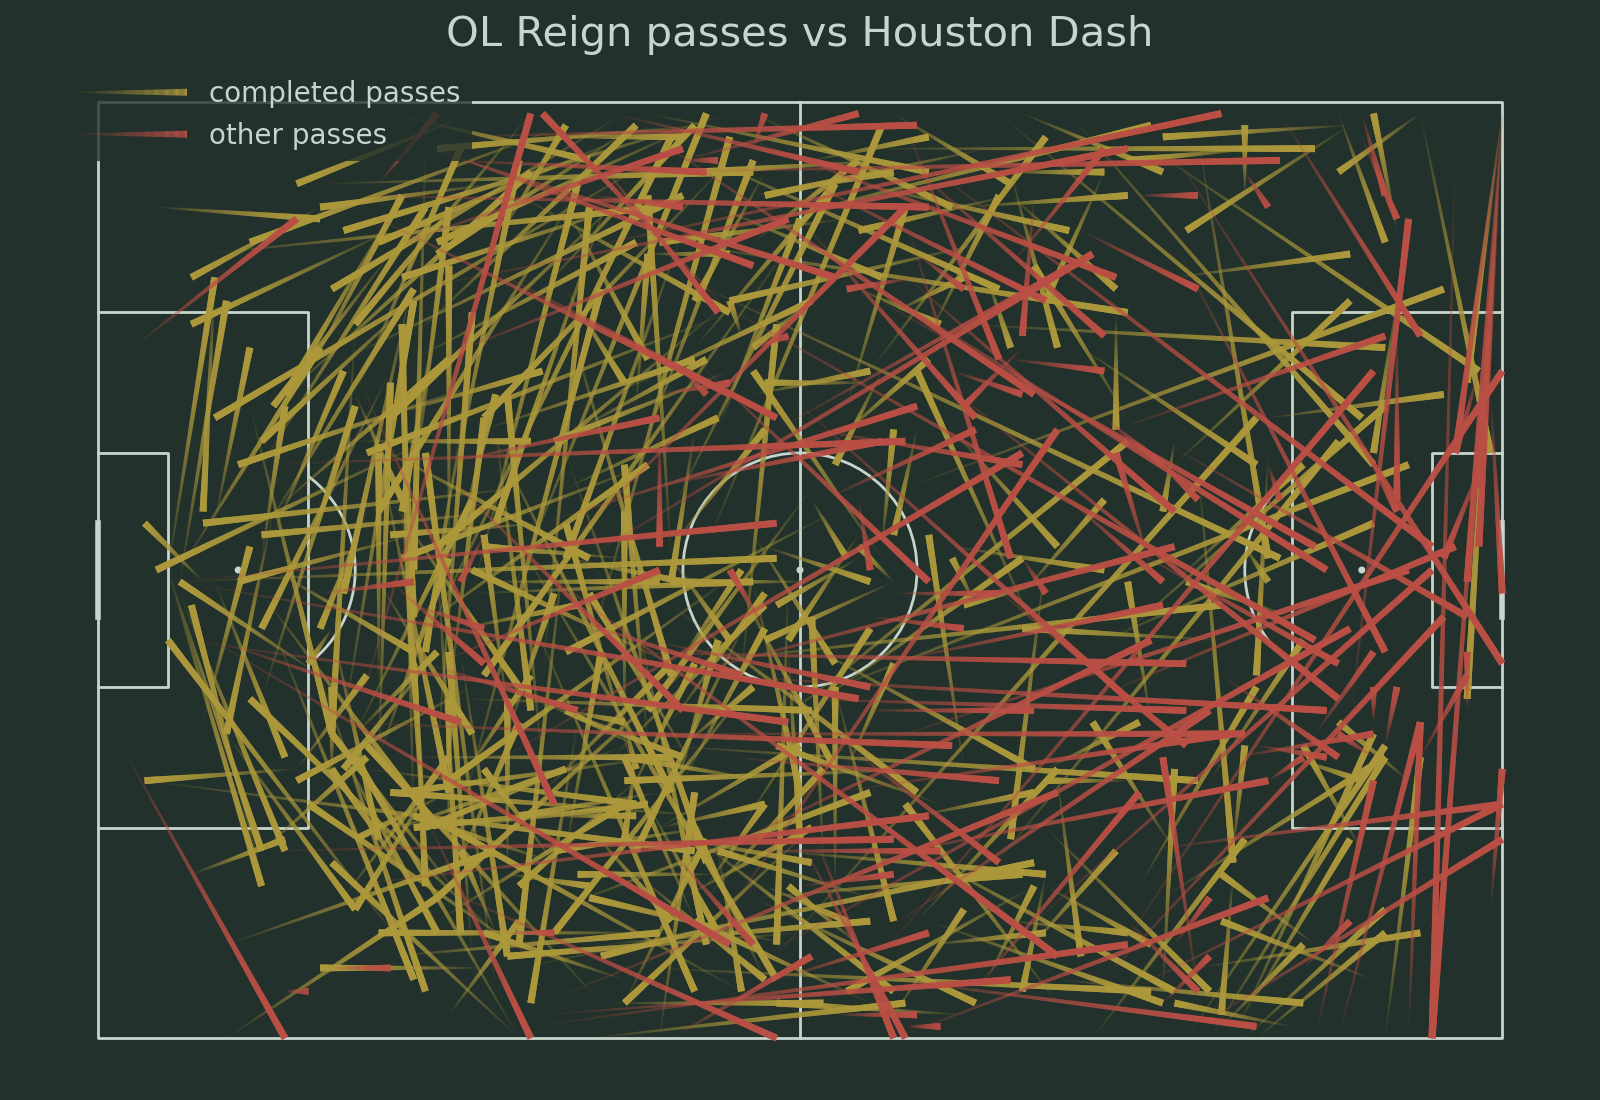
passes
passes = game.passes()
passes.network(selected='home')
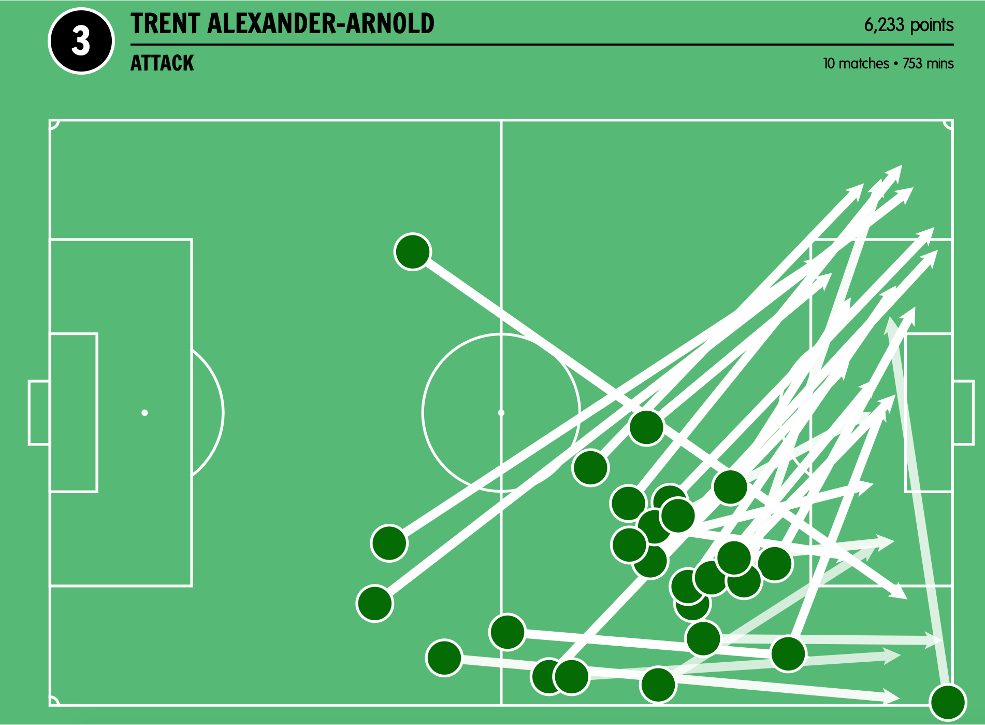
passes.passmap(selected='home')
passes.passmap(id='66')
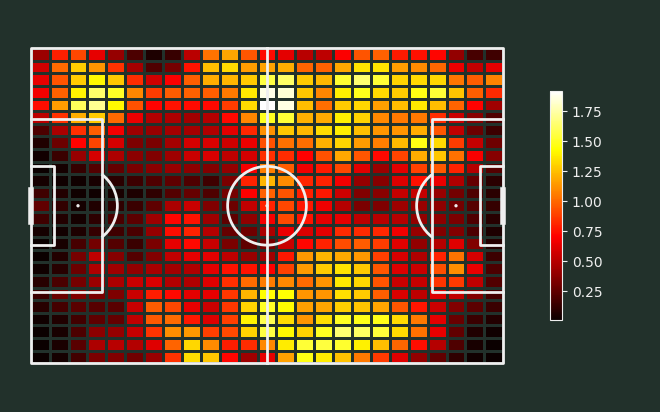
其他
touches = game.touches()
touches.heatmap(selected='home')
games
可以站在 games 集合的角度查看一些统计数据
games = Games(Game(...), Game(...), Game(...))
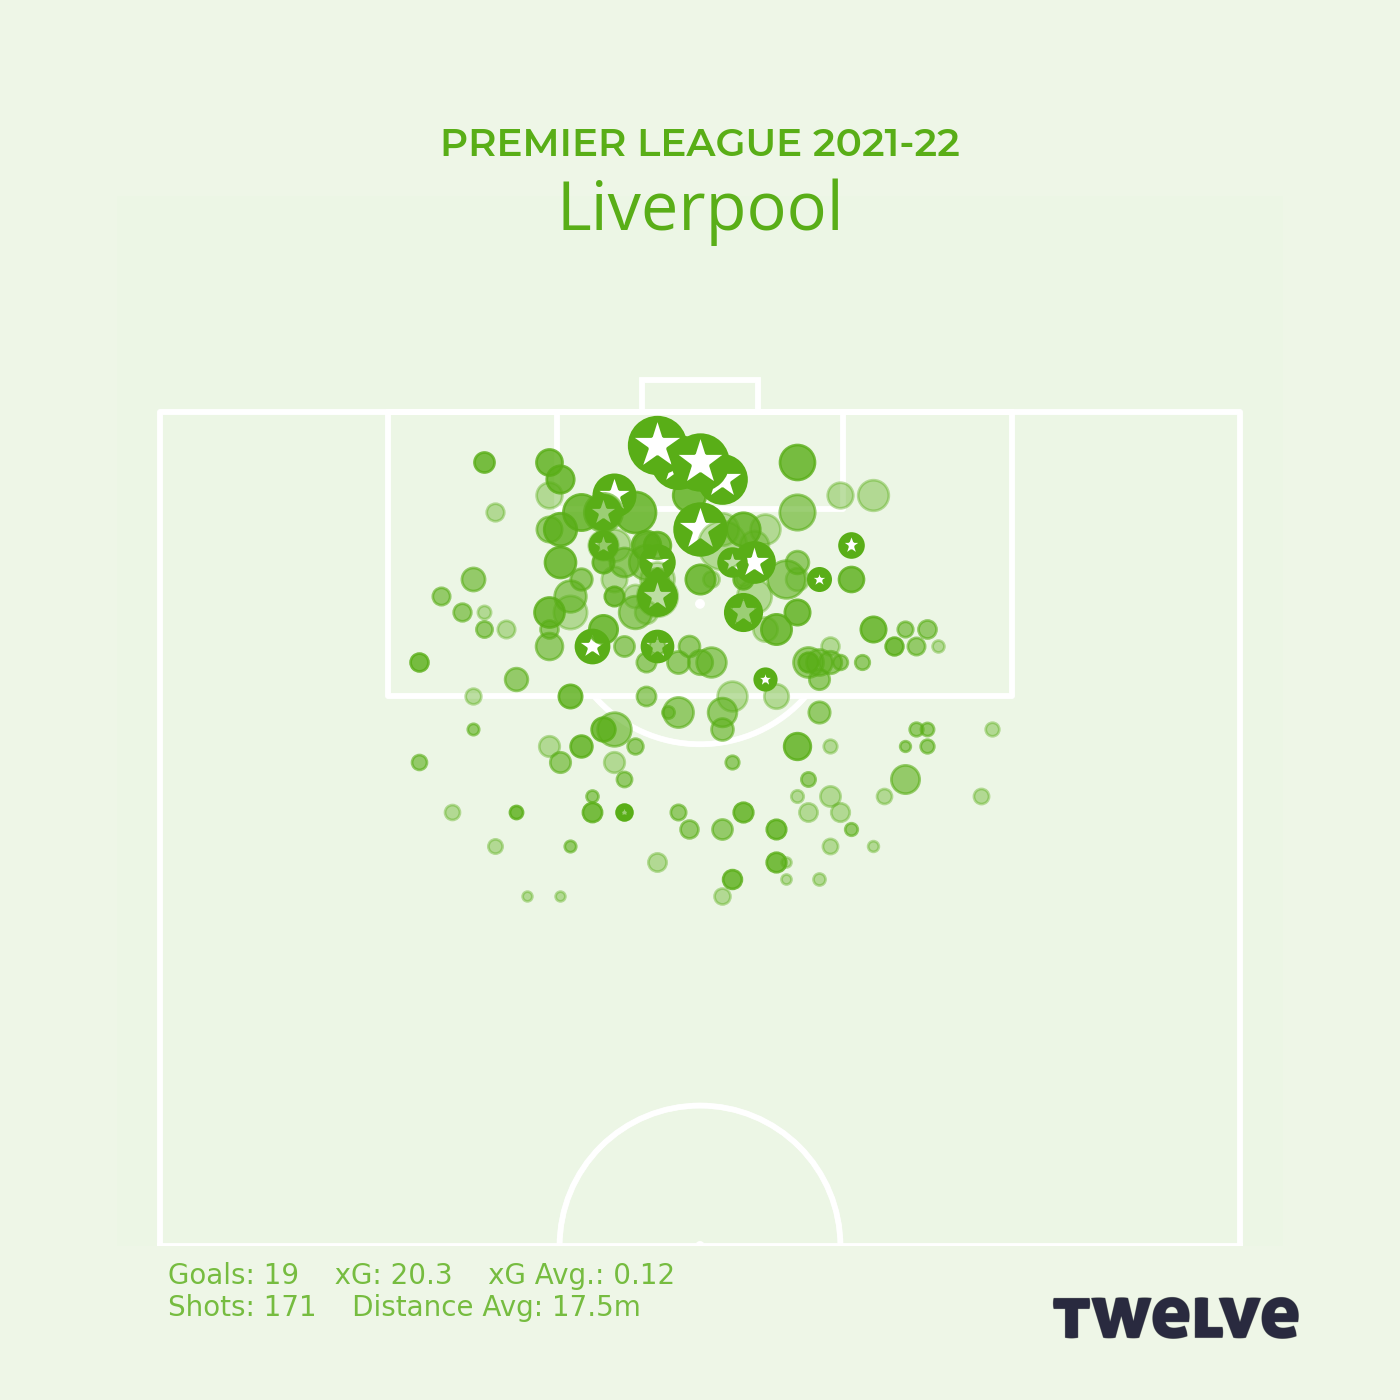
shots = games.shots()
shots.shotmap(team='liverpool')
touches = games.touches()
touches.countmap()
接下来就是设计好用的 api 和参数,以及具体代码实现。坑越挖越大了。